Current Projects
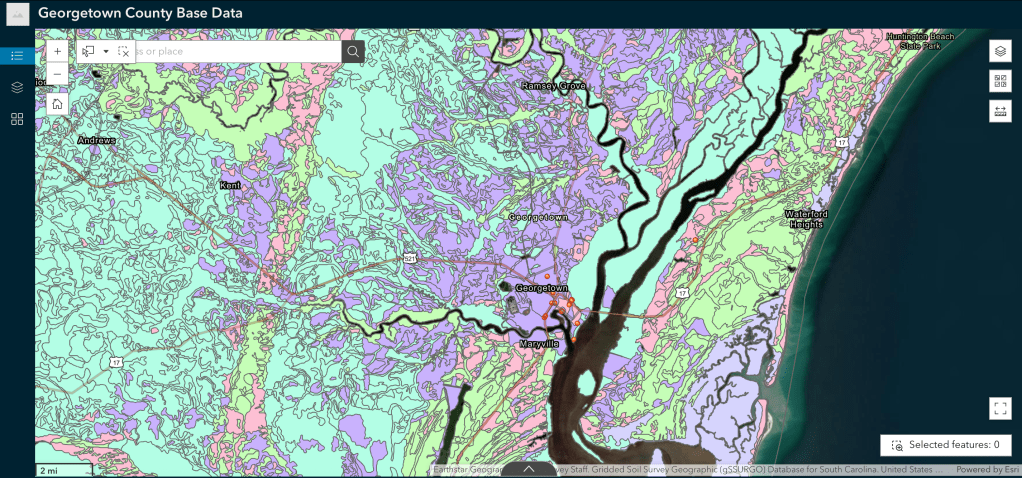
Nature-Based Solutions to Mitigate Flooding in Georgetown, South Carolina
Levine Lab, Department of Geology, College of Charleston, in partnership with Georgetown County, City of Andrews, City of Georgetown, South Carolina Seagrant Consortium, the Belle W. Baruch Foundation (Hobcaw Barony), and Robinson & Design Engineers.
Working to identify priority areas for the implementation of nature-based solutions to mitigate flooding. The ArcGIS Experience Builder below presents a visualization of non-proprietary data layers pertinent to inundation analysis that have been collected, isolated, and visualized as part of the initial phase of this project. Sites of interest were collected with Survey123 and then turned into a data layer file.
Click the image below to explore the map.
Portfolio
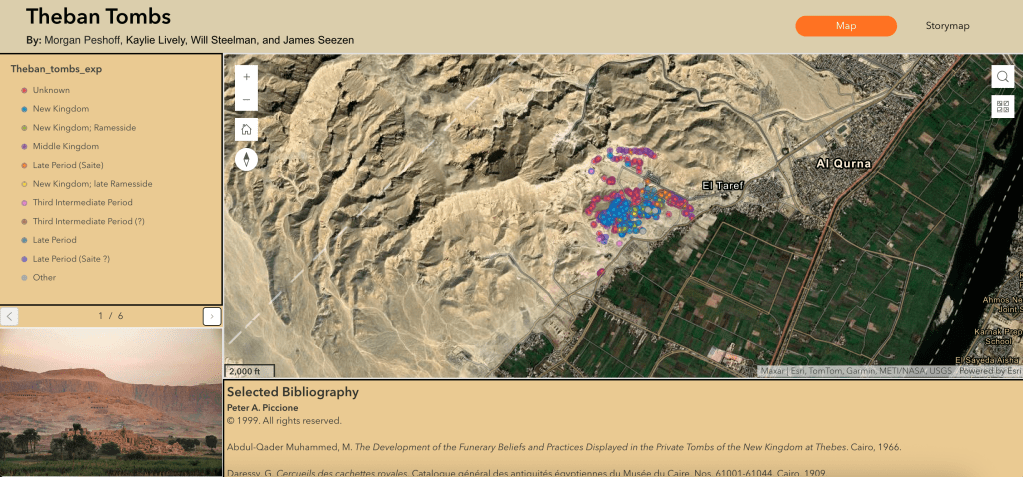
Mapping Egyptian Theban Tomb Archeological Dig Sites
Levine Lab, Department of Geology, & Dr. Peter Piccione, Department of History, College of Charleston
Working with a handful of geology students, we took raw anthropological data, including site images, to create an interactive map by converting the information into geospatial points—some of which included embedded images as part of their attribute data. I then used this map to build an application in ArcGIS Experience Builder that allowed users to explore archaeological dig sites by age. When a site was selected, the app displayed all relevant details, including descriptive information and associated images, enabling a dynamic and visually rich way to interpret the dataset.
Click the image below to explore the map.
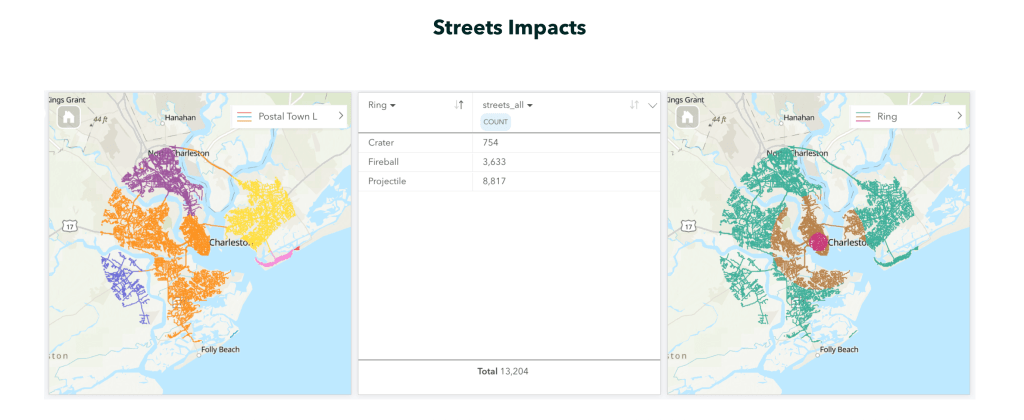
Projected Impacts of Hypothetical Natural Disaster (Asteroid/Bolide) on Charleston, South Carolina
This project examines the impacts of a 100-meter diameter stoney meteor striking downtown Charleston, South Carolina. Three impact zones or “rings” resulting from the strike are calculated in Microsoft Excel with data from ImpactEarth and visualized with ArcGIS Pro; the rings are the crater, the fireball blast, and the projectile range. The crater and the fireball rings were noted to decimate anything within them. To get a further idea of the impact of the meteor by ring, data characterizing the rings including demographics, business information, municipalities, wetlands, bodies of water, streets, parcels, and streams were collected. These data were then processed in ArcGIS Pro using ModelBuilder and clipping tools to be characterized for each respective ring. These data were the visualized with ArcGIS Insights and an ArcGIS Instant App.
Click the image below to view the ESRI Story Map featuring the data collected and produced for this project.
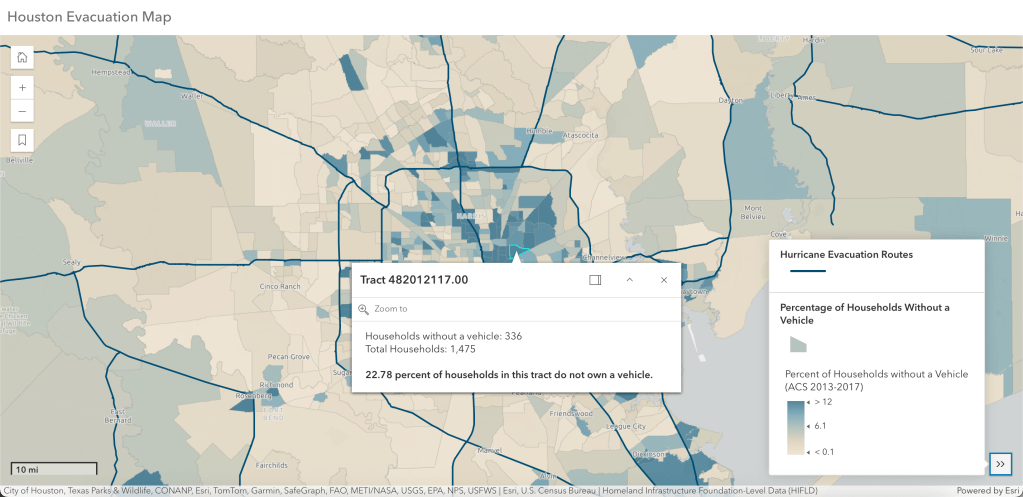
Houston, Texas Evacuation Routes Cross-Referenced with the Number of Households with Vehicles for Risk Assessment
Demographics and hazards data was used to map evacuation routes for Houston, Texas and collect the number of vehicles and households in population blocks in the area. Using these data with ESRI tools such as ArcPro and ArcGIS Online, this interactive Web App was designed to display the risk of specific population block groups for evacuation.
Click on the image below to view the interactive application.
Certifications
2024 – ArcGIS Insights: Using Design Principles to Enhance Visuals (ESRI)
2024 – ArcGIS StoryMaps: Telling Stories with Maps (ESRI)
